When COVID-19 was first detected in China in late 2019, some of my teammates at Philips were on the front lines. Our Philips Research leader in North America was an immunologist, who immediately offered the entire staff the freedom to from home as we’d had Chinese colleagues visiting in October and November 2019. As it became apparent we were looking at a potential global pandemic in January 2020, much of the company was mobilizing to ramp up production of respirators and other medical device needs. And a research team that had been focused on building an algorithm for early detection of infectious diseases realized their project may have potential to help be used in screening for COVID.
Discovery & Research
Philips Research been working with a government agency called DTRA (Defense Threat Reduction Agency) to create a solution that could potentially detect the likelihood someone may be coming down with an infectious disease based on data coming from wearables.
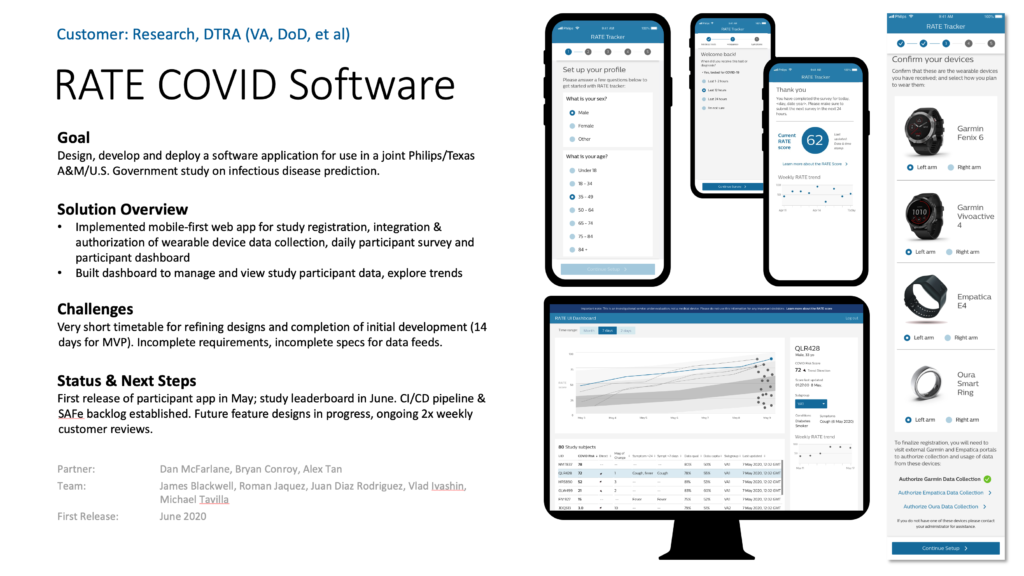
A team was rapidly mobilized to build software to support a study which involved monitoring a number of separate cohorts – Navy service people, aging adults in an assisted living community and university students volunteers. The goal was to tune their algorithm for detecting infectious diseases inside hospitals for detecting COVID – anywhere.
Ideation
Our team consisted of 2 research leads, 7 research & data scientists, 3 software developers; our Innovation Hub team was charged with designing and building a software application that could be deployed on anyone’s existing web and/or mobile devices.
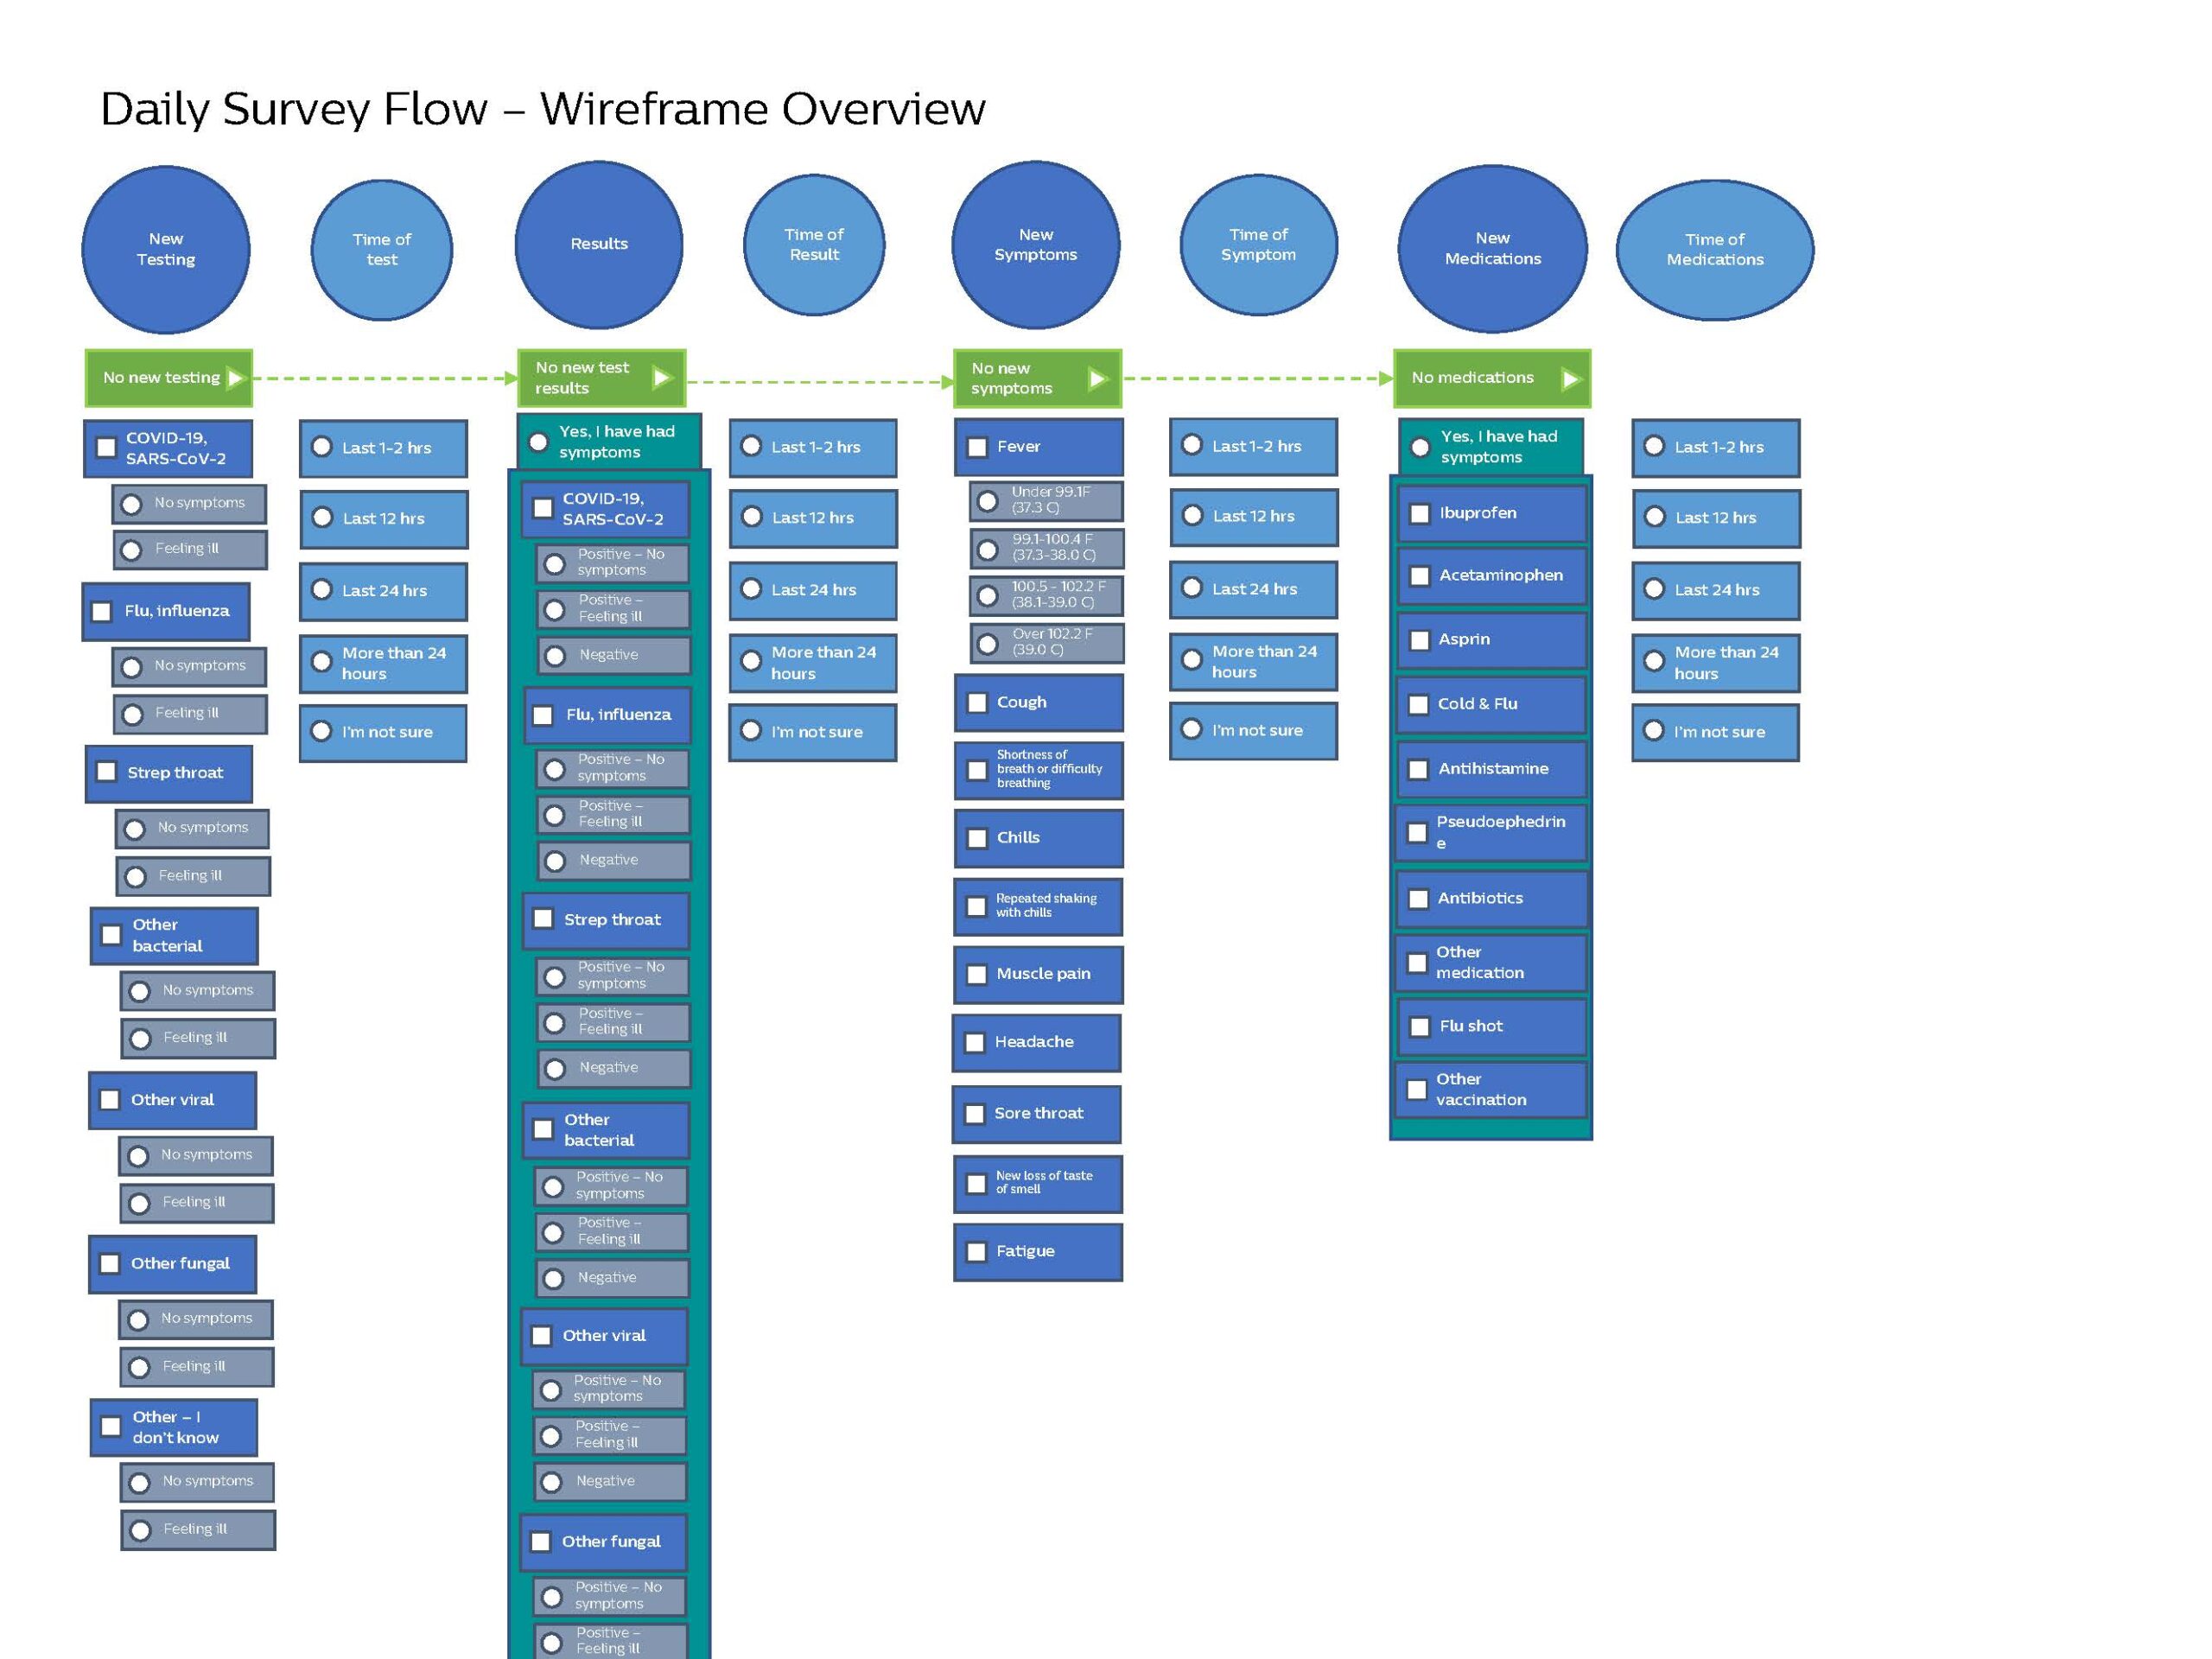
The algorithm required vitals data from devices – but the other essential information needed to properly train the ML engine was context about potential symptoms – or lack thereof.
Design Work
The app needed two separate interfaces for different groups of users, using the same back end:
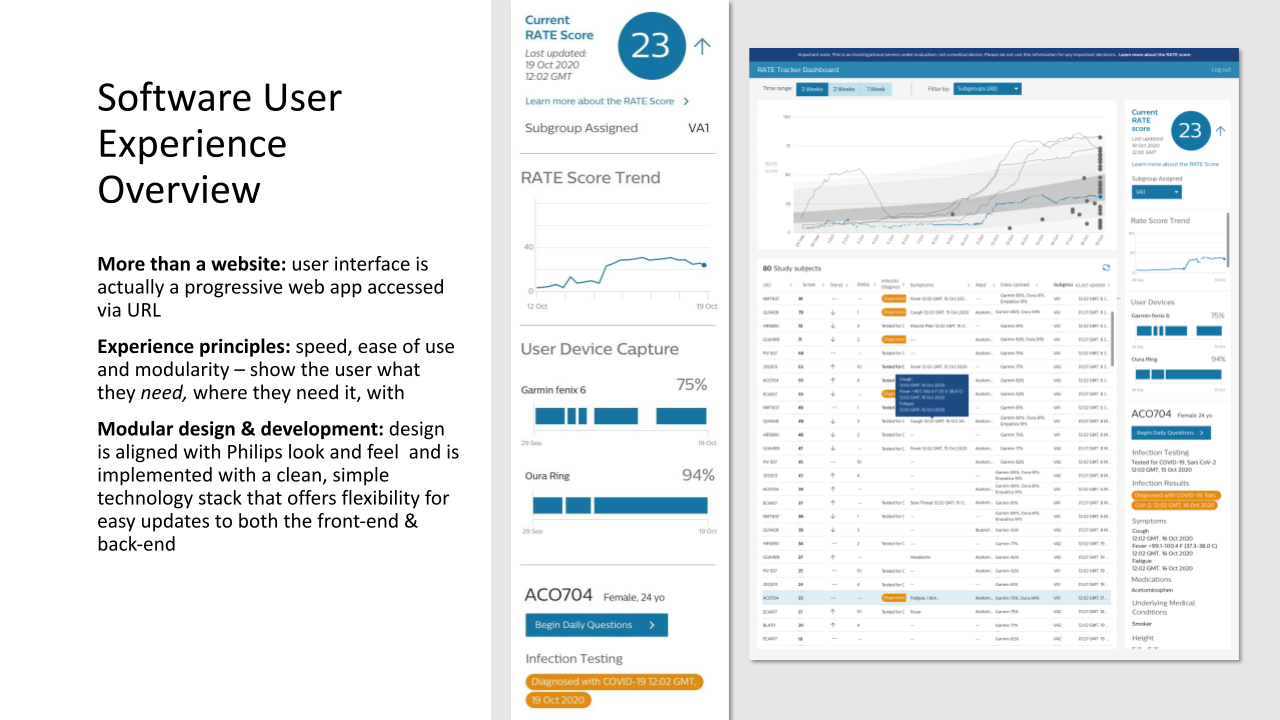
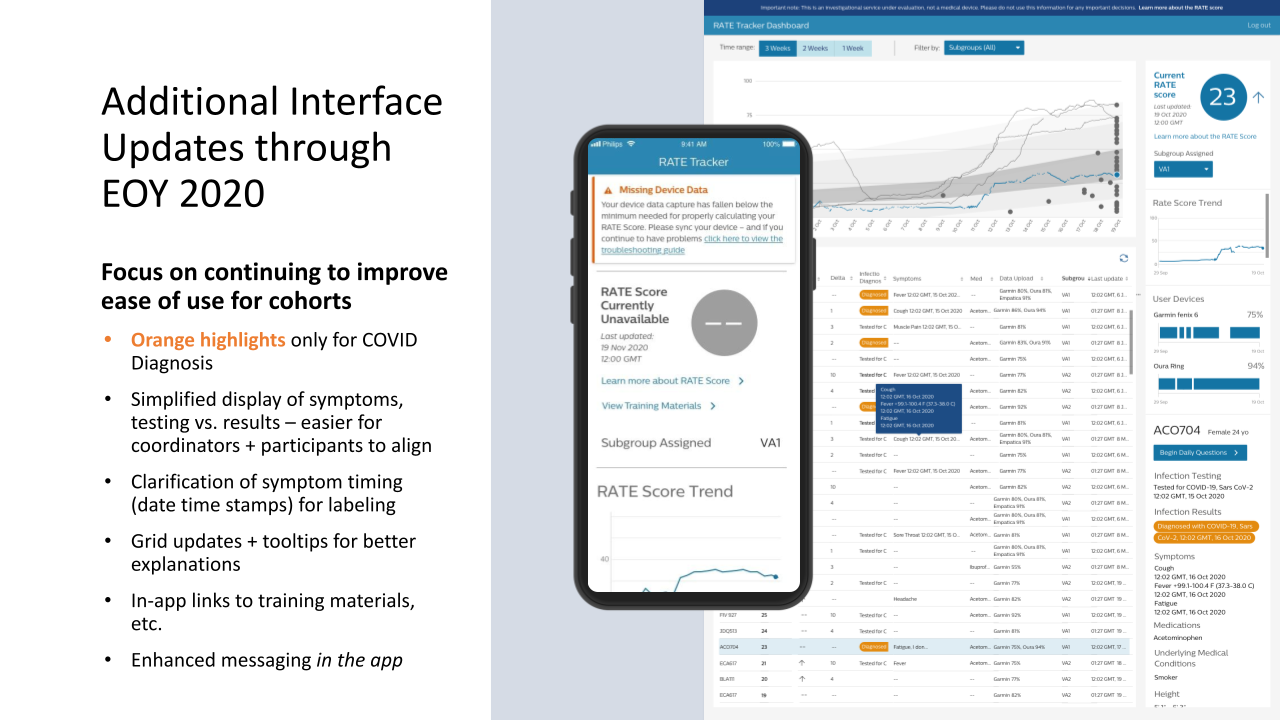
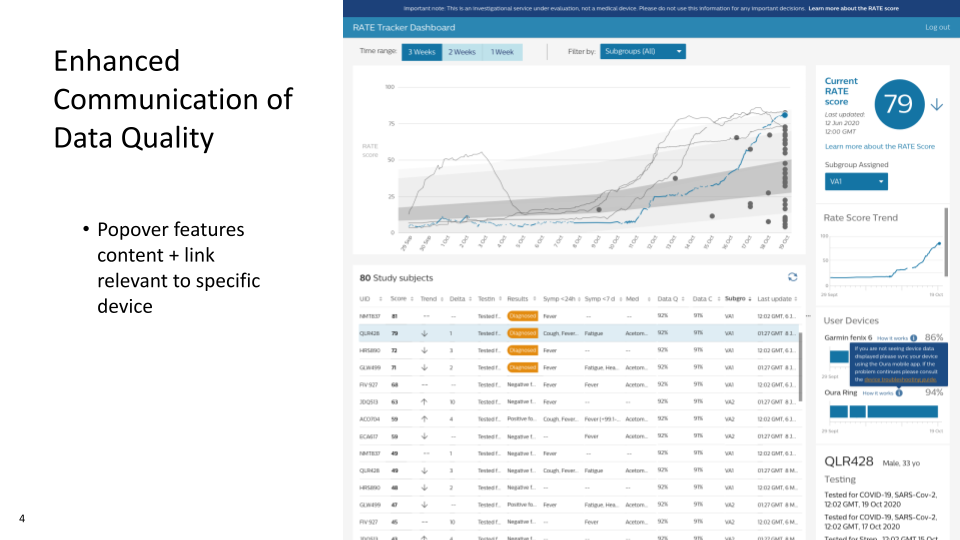
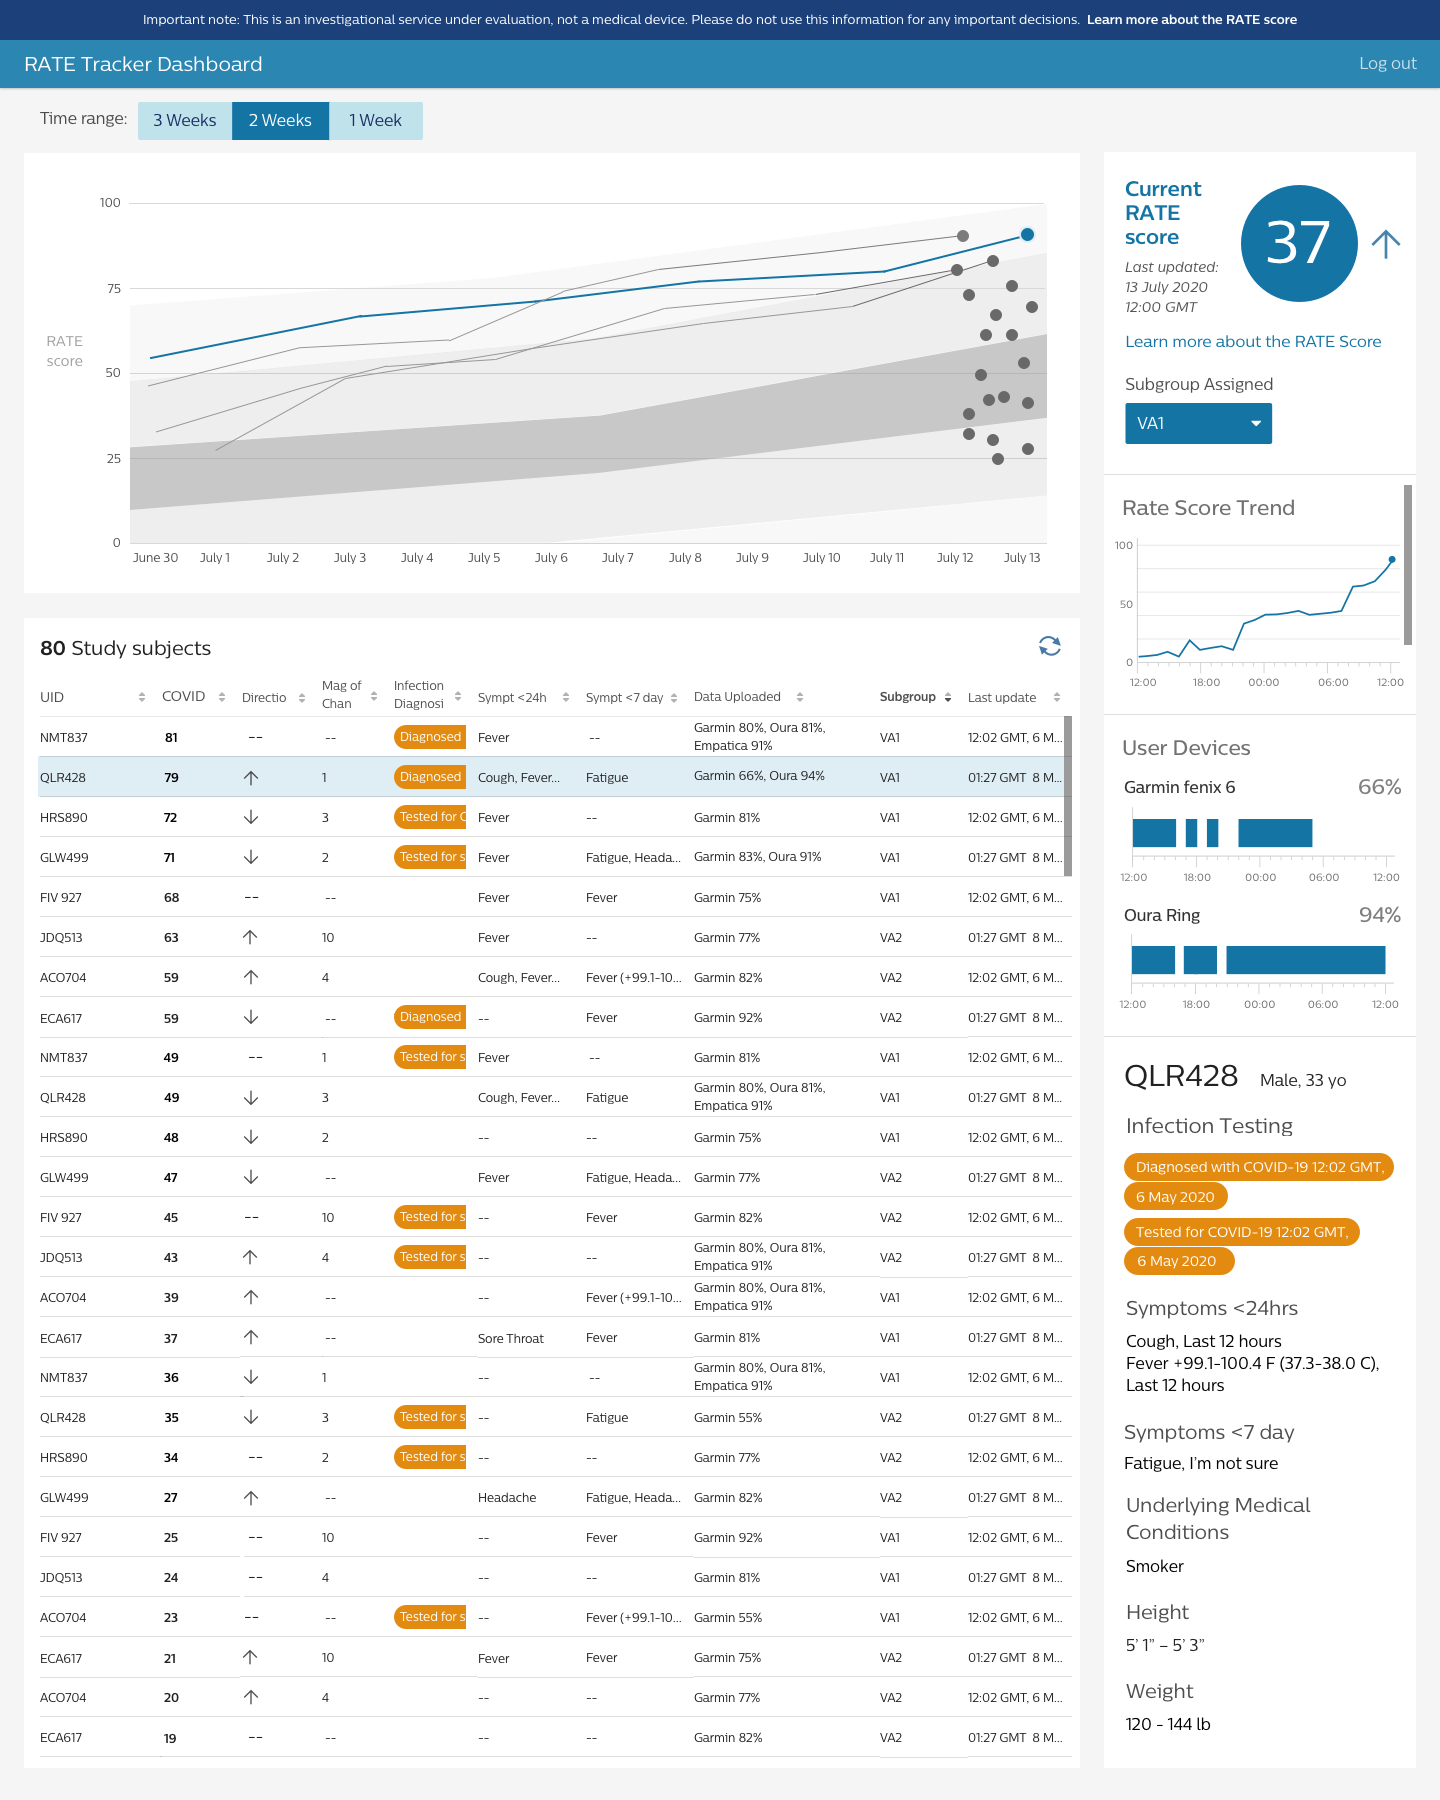
A dashboard for command to monitor cohorts, with data visualizations to show trends at the group and individual level
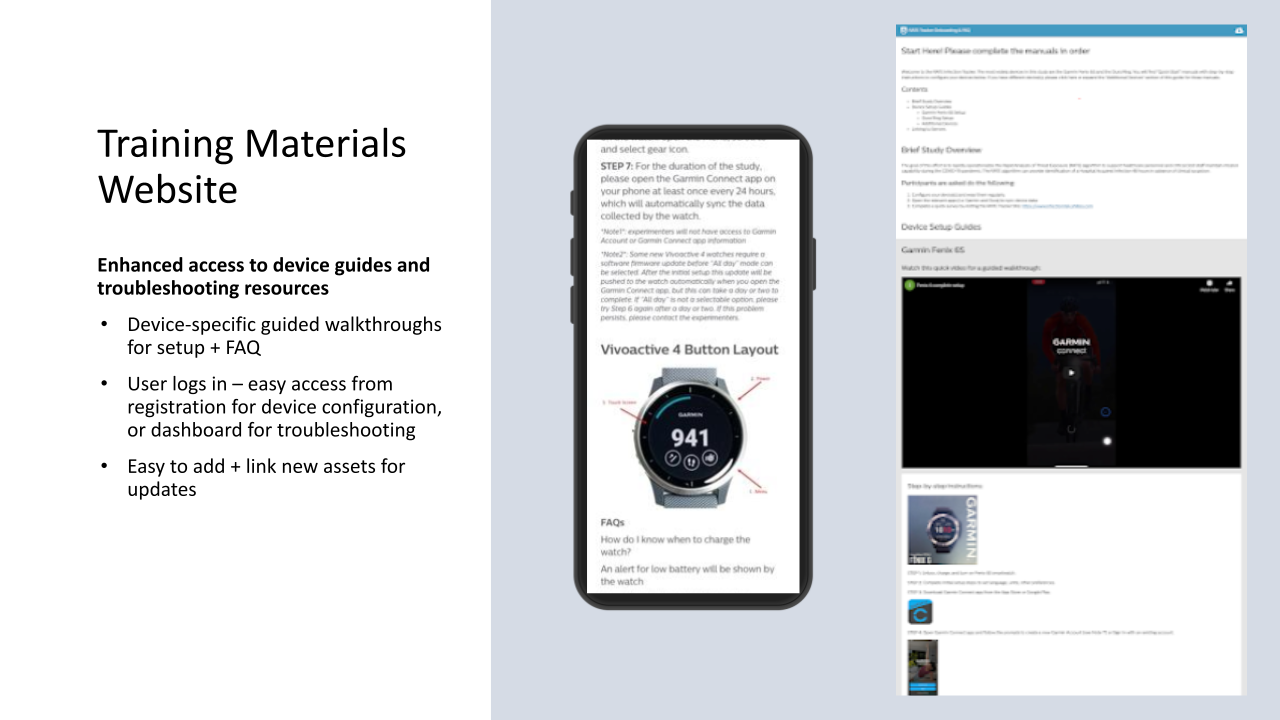
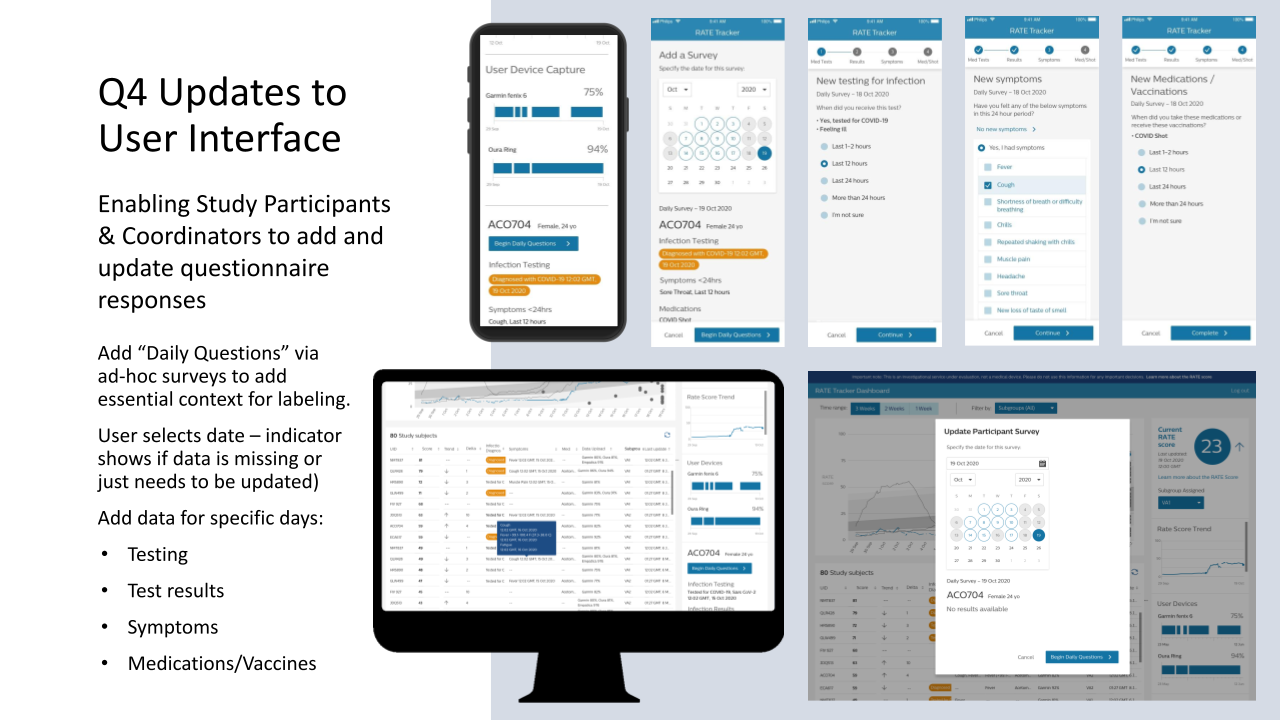
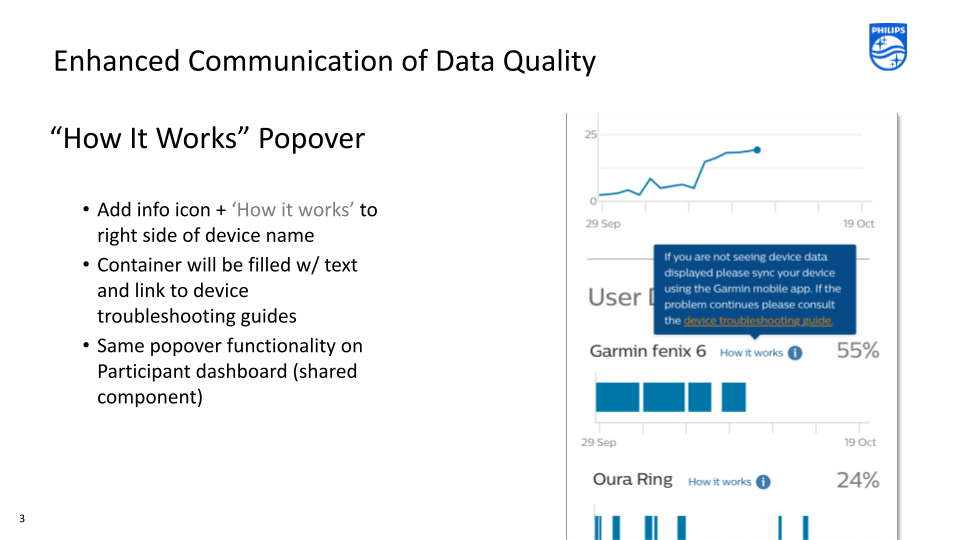
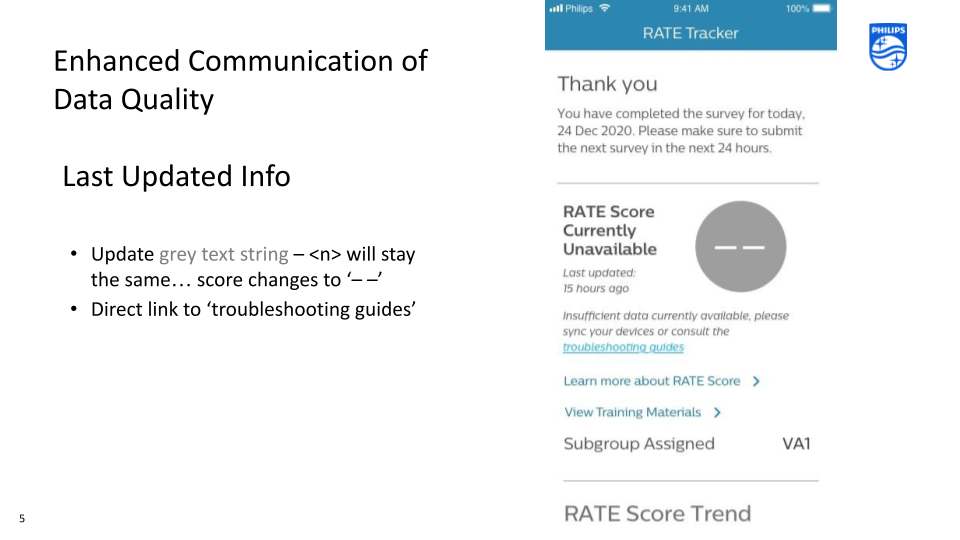
A mobile first participant interface that allowed members to manage their wearable configurations, and fill out a daily questionnaire providing information about symptoms
The data visualization proved to be a bit complex – we needed to be sure to display time series data mixed with categorical and survey data in the same graph. So we designed & developed a custom chart with a mix of line and scatter plot indicators to give command an at-a-glance understanding of outlier participants (potential positive cases) and the overall trend of all the patients in the cohort.
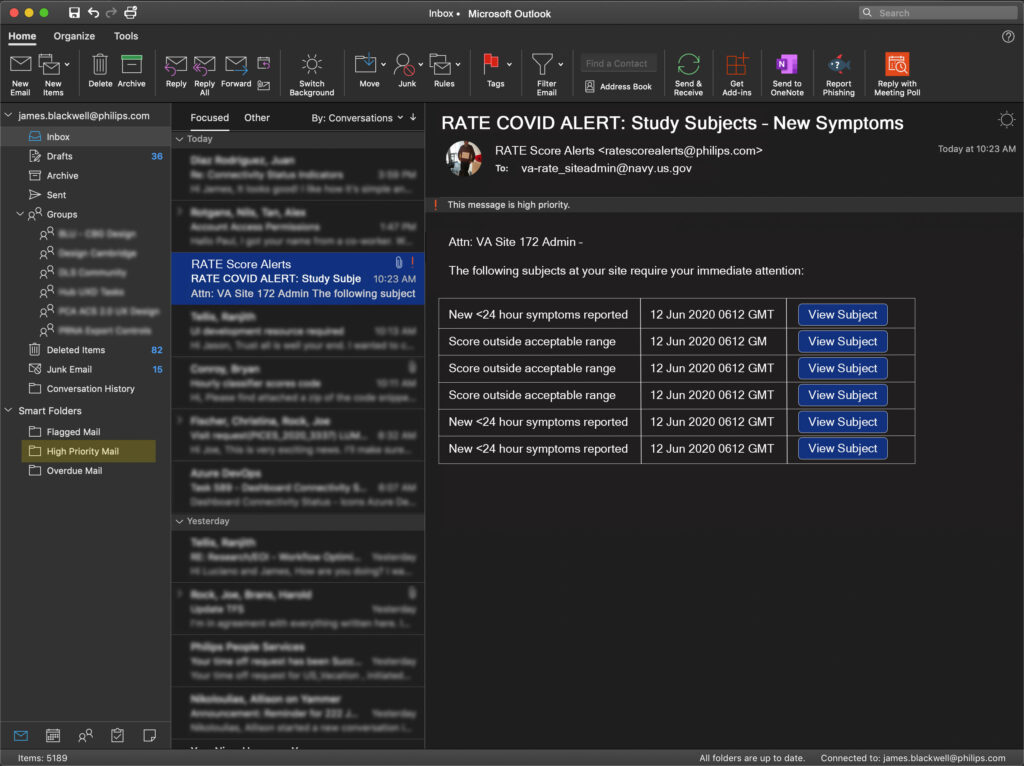
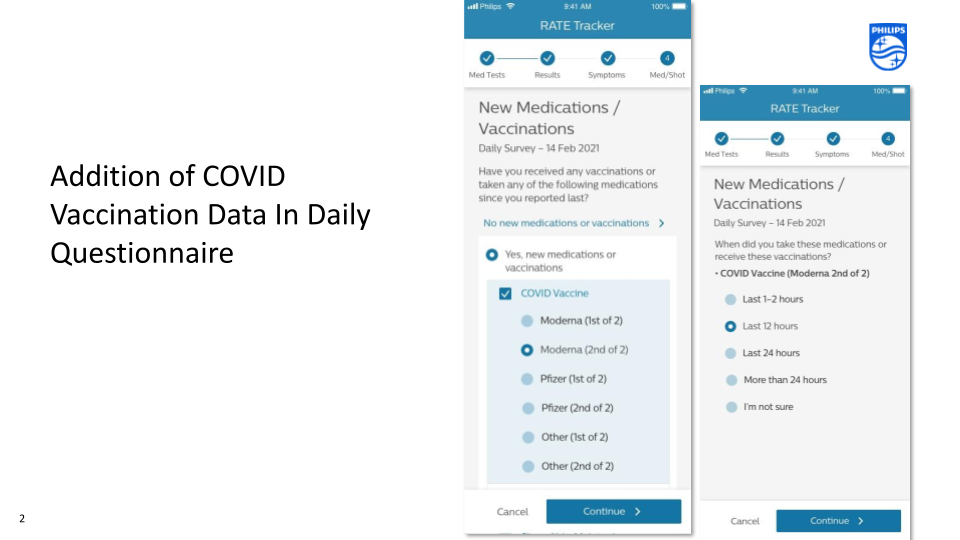
As the pandemic progressed and we learned more about COVID-19 we continued to train and improve the algorithm by adding features to the software enabling participants to add information about other factors – like OTC medications taken and alcohol use. We also gave study coordinators the ability to update participant info manually as people began so settle and started forgetting to fill out their daily surveys.
Initial results proved very promising and the US Dept. of Defense began to publicize findings in the fall of 2020. They found tremendous value in predicting the likelihood of COVID-19 as outbreaks could have serious impact on force readiness for the military.